Kodjin Analytics and Tableau both help organizations turn data into decisions. But they are built for different problems.
Tableau is a mature BI platform for visual analytics, dashboards, and reporting across many business domains. Kodjin Analytics is built for healthcare data: FHIR® resources, clinical concepts, patient cohorts, care pathways, quality measures, and governed access to sensitive information. For organizations that need analytics built around clinical meaning rather than generic reporting, Kodjin Analytics provides a specialized Tableau alternative.
So the choice is not only about which tool has better charts. It is about how much healthcare-specific work has to happen before users can trust the answer.
Quick Comparison: Kodjin Analytics vs. Tableau
This Kodjin Analytics and Tableau comparison looks at the main differences between Kodjin Analytics and Tableau, including data models, AI capabilities, integrations, governance, pricing, and time to value.
| Feature | Kodjin Analytics | Tableau |
| Best for | Healthcare analytics across clinical, operational, financial, and FHIR-based data | General BI, dashboards, and self-service reporting |
| Main strength | Healthcare semantics, governed natural-language access, cohort and pathway analytics | Mature visualization, dashboards, and broad BI adoption |
| Data model | Healthcare semantic layer with clinical concepts, measures, cohorts, and events | Tableau data model with relationships, joins, unions, extracts, and published data sources |
| FHIR support | Built for FHIR-aware healthcare analytics | Not positioned as FHIR-native in the core BI layer; usually requires preparation or connectors |
| AI capabilities | Conversational analytics, visual query builder, healthcare-specific semantic logic | Tableau Pulse, Tableau Agent, Tableau Next, and Tableau Semantics |
| Pricing | Solution-based, depending on implementation scope | Role-based pricing for Viewer, Explorer, and Creator users |
Overview of Kodjin Analytics
Kodjin Analytics by Edenlab is a healthcare analytics solution for organizations that need more than dashboards over prepared tables. It is designed for questions where the meaning of the data matters as much as the visualization.
That is usually where healthcare analytics becomes difficult. A “readmission,” a “high-risk patient,” or a “cardiac event” is not just a column name. It can depend on diagnosis codes, encounter types, lab results, medication history, exclusions, time windows, and terminology mappings.
Kodjin Analytics addresses this through a healthcare semantic layer. Instead of rebuilding definitions separately for every dashboard, teams can work with governed measures, dimensions, cohorts, and events. This matters because healthcare data should support decisions, not create another layer of disagreement.
For organizations using FHIR or moving toward a FHIR-based architecture, this is especially relevant. FHIR data is powerful, but it is not naturally shaped for traditional BI. Resources are nested, linked, and terminology-heavy. Kodjin is built closer to that healthcare data reality.
Key Features
- Conversational analytics and visual query building.
- Healthcare semantic layer for shared definitions.
- Support for FHIR-based data structures and terminology-aware analytics.
- Cohort, longitudinal, and patient pathway analysis.
- Healthcare KPI dashboards and API-first integration.
Pros and Cons
Pros: healthcare-native design, strong fit for FHIR-based data, governed natural-language access, and better alignment with cohorts, pathways, and longitudinal analysis.
Cons: more specialized than general BI software, less relevant for organizations that only need standard business dashboards, and still dependent on disciplined implementation and governance.

Overview of Tableau
Tableau is one of the best-known BI and visual analytics tools on the market. Its value is straightforward: connect to data, build interactive dashboards, publish them, and let users explore information without asking for a custom report every time.
This makes Tableau useful in many healthcare scenarios. Providers and health organizations can use it for patient flow dashboards, revenue cycle reporting, supply chain visibility, executive reporting, and operational performance management. If the data is already clean, modeled, and ready for analysis, Tableau gives teams a mature way to visualize and distribute it.
The limitation is that Tableau is not healthcare-native. It does not, by itself, understand clinical terminology, FHIR relationships, cohort logic, or longitudinal patient records. Those layers have to be prepared before Tableau can produce reliable healthcare insights.
For the Tableau side of this comparison, product capabilities and licensing references are based on Tableau’s official product overview, AI product pages, and help documentation.
Key Features
- Drag-and-drop visual analytics.
- Interactive dashboards, maps, stories, and embedded views.
- Broad connectivity to databases, files, cloud platforms, and applications.
- Live connections and extracts for different freshness and performance needs.
- Tableau Pulse, Tableau Agent, Tableau Next, and Tableau Semantics.
Pros and Cons
Pros: mature BI product, strong visualization, broad connector ecosystem, flexibility across finance, sales, operations, inventory, and management use cases, and a large support ecosystem.
Cons: not built around healthcare semantics, FHIR analytics usually requires preparation outside the core BI layer, and advanced AI or semantic features may depend on edition, licensing, or Salesforce ecosystem components.
Feature-by-Feature Comparison
Core Features
Tableau and Kodjin Analytics overlap at the output layer: both can help users analyze data and communicate insights. But they start from different assumptions.
Tableau starts from the BI workflow: connect data, prepare a model, create visualizations, publish dashboards, and let teams explore. Kodjin starts from the healthcare data problem: fragmented sources, clinical meaning, terminology, time-based logic, and governance.
Better fit: Tableau for broad BI; Kodjin Analytics for healthcare-specific analytics.
AI and Automation Capabilities
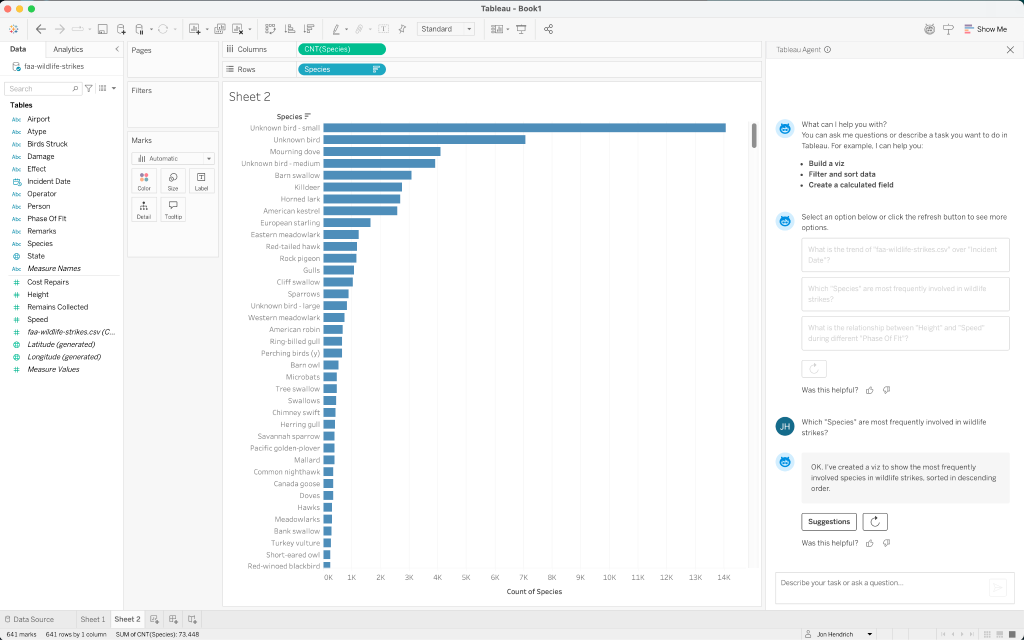
Tableau’s current AI direction is built around Tableau Pulse, Tableau Agent, Tableau Next, and Tableau Semantics. Pulse focuses on personalized metric insights and guided exploration, helping users understand changes in KPIs without manually opening a dashboard every time. Tableau Agent supports assisted analysis work, including creating visualizations, exploring data, and explaining calculated fields. Tableau Semantics adds a business-language layer so AI features can work with trusted definitions instead of raw technical fields.
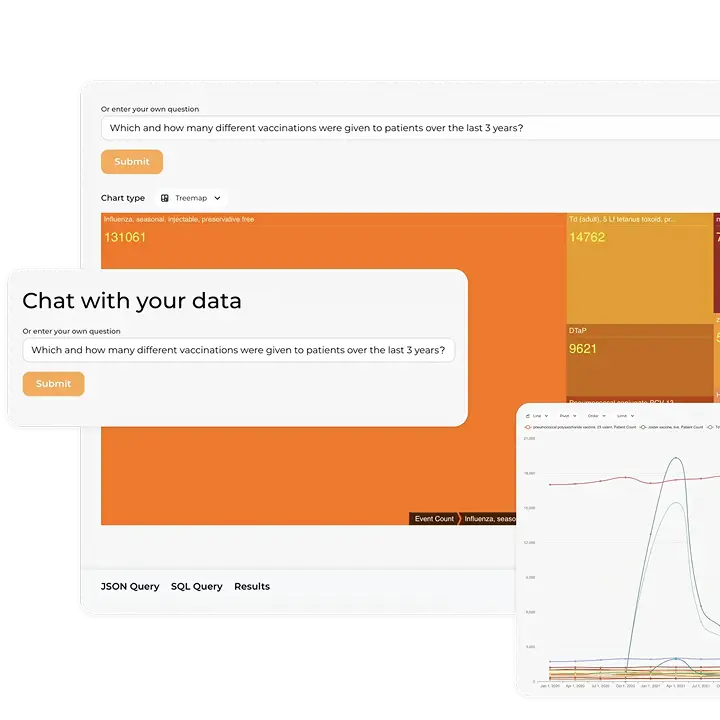
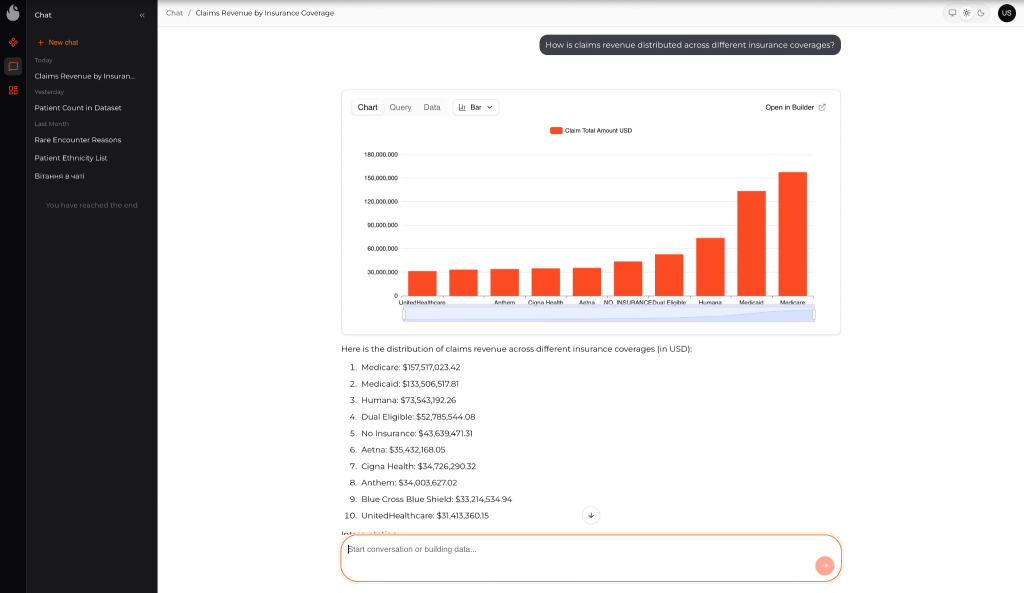
Kodjin Analytics applies AI to a different problem: making complex healthcare data easier to query, interpret, and reuse without losing governance. Its conversational interface helps users ask clinical, operational, or financial questions in plain language, while the semantic layer keeps those questions tied to approved definitions, terminology logic, access rules, and healthcare-specific metrics. Instead of treating AI as a general assistant over any dataset, Kodjin uses it as an access layer over governed healthcare concepts.
The difference is in the starting point. Tableau is strong when AI is used to speed up BI work over well-modeled business data. Kodjin Analytics is stronger when AI needs to work with healthcare data that depends on FHIR structures, clinical meaning, cohorts, pathways, and controlled definitions.
Better fit: Tableau for AI-assisted BI; Kodjin Analytics for governed healthcare conversational analytics.
Data Model and Healthcare Semantics
Tableau gives teams several ways to model data: relationships, joins, unions, extracts, published data sources, and newer semantic capabilities. For many business questions, that is enough.
Healthcare data needs more structure. A cohort can depend on age, condition history, lab values, medication exposure, encounters, and timing. A quality measure can depend on inclusion criteria, exclusion rules, reporting periods, and coded concepts. If that logic lives in separate dashboards, the organization quickly ends up with conflicting answers.
Kodjin Analytics is built to centralize that logic. The point is not only faster reporting. The point is consistency.
Better fit: Kodjin Analytics for healthcare semantics; Tableau for flexible business data modeling.
Integrations and FHIR Support
Tableau has a strong integration ecosystem. It can connect to many databases, warehouses, cloud services, files, and enterprise tools. For organizations with a mature data stack, this is a real advantage.
FHIR changes the picture. FHIR resources are nested, linked, and designed for healthcare interoperability. They usually need transformation before they can be analyzed like ordinary tables in a BI tool. In Tableau architectures, FHIR use cases often depend on a warehouse, lakehouse, accelerator, transformation process, or third-party connector.
Kodjin Analytics is stronger when FHIR is not just another source, but the foundation of the analytics model.
Better fit: Tableau for broad integrations; Kodjin Analytics for FHIR-centered healthcare analytics.
Visualization and Analytics Scope
Tableau’s visual layer is its biggest strength. It is mature, flexible, and familiar to many analysts. Teams can build polished dashboards, maps, filters, drill-downs, stories, and embedded views.
Kodjin Analytics is not trying to compete only as another dashboard canvas. Its value is in the healthcare analytics layer behind the output: cohorts, pathways, longitudinal trends, quality measures, operational bottlenecks, and natural-language access to governed data.
If the organization needs dashboards from clean data, Tableau is hard to beat. If the organization needs reliable healthcare answers from complex data, Kodjin is closer to the real problem.
Better fit: Tableau for visualization breadth; Kodjin Analytics for healthcare analytics depth.
Security, Compliance, and Governance
Tableau has enterprise security and governance options, including permissions, row-level security, activity tracking, and compliance support depending on deployment and licensing. It can be used in healthcare contexts when the right contracts, configuration, and operational controls are in place.
Kodjin Analytics starts from a healthcare environment where protected data, auditability, role-based access, and governed definitions are baseline requirements. That does not remove implementation work, but it makes healthcare governance part of the architecture from the start.
Better fit: Tableau for configurable enterprise BI governance; Kodjin Analytics for healthcare-first governance patterns.
Is There a Better Alternative for Healthcare Analytics?
The better question is not whether Kodjin Analytics or Tableau is universally better. The better question is what kind of analytics problem the organization is trying to solve.
Tableau is a strong option for visual BI. It is mature, flexible, and widely used. For many companies, it is a safe choice for dashboards and reporting.
But healthcare analytics often breaks before the dashboard stage. The issue is fragmented data, unclear definitions, inconsistent measures, and limited access to trusted answers. That is where Kodjin Analytics stands out. It focuses on the healthcare-specific layer that generic BI tools usually expect the organization to prepare elsewhere.
Explore our Conversational Healthcare Software
Learn more
Why Kodjin Analytics May Be a Stronger Option
| Evaluation Area | Why Kodjin Analytics Stands Out in Healthcare |
| Healthcare data complexity | Works with clinical, operational, financial, and longitudinal healthcare data |
| FHIR analytics | Better aligned with FHIR-based data and interoperability workflows |
| Natural-language access | Lets users ask healthcare questions against governed definitions |
| Semantic consistency | Keeps measures, cohorts, dimensions, and events consistent |
| Time to value | Reduces the need to rebuild healthcare logic for every dashboard |
| Advanced healthcare use cases | Stronger fit for cohorts, pathways, quality measures, and temporal logic |
| Governance | Matches healthcare expectations around access control, auditability, and sensitive data |
The risk for healthcare teams is not choosing a tool with fewer features. The bigger risk is building analytics on top of definitions nobody fully trusts.
Final Verdict: Kodjin Analytics or Tableau?
Choose Tableau if the main need is visual BI: dashboards, reports, embedded analytics, and flexible exploration across many business functions.
Choose Kodjin Analytics if the main need is healthcare analytics: FHIR support, clinical semantics, governed natural-language questions, cohorts, patient pathways, terminology-aware models, and faster access to decision-ready healthcare insights.
For healthcare analytics, especially when FHIR, semantic consistency, and governed AI access matter, Kodjin Analytics is the stronger fit.
FAQs
Which is better, Kodjin Analytics or Tableau?
Kodjin Analytics is Tableau alternative for healthcare-specific analytics, FHIR data, governed clinical concepts, and natural-language healthcare questions. Tableau is better for general-purpose BI and visual dashboards.
Does Tableau support FHIR?
Tableau is not positioned as a FHIR-native analytics platform in its core BI layer. FHIR-related analytics usually requires preparation through a warehouse, lakehouse, accelerator, transformation process, or third-party connector.
Are there alternatives to Kodjin Analytics and Tableau?
Yes. Alternatives to Kodjin Analytics and Tableau include Power BI, Looker, Qlik, and healthcare-focused analytics solutions. Product reviews can help compare usability and support, but healthcare teams should also evaluate FHIR readiness, semantic governance, security, and implementation effort.
Who should choose Tableau?
Choose Tableau if your company needs mature BI software with strong dashboards, broad data connectivity, a large community, and flexible analytics across many business functions.
Who should choose Kodjin Analytics?
Choose Kodjin Analytics if your organization needs a healthcare analytics solution for clinical, operational, financial, quality, or research use cases built around governed healthcare data.