Population health analytics looks different in every region because demographics, funding, and data rules vary. We frame this article through the European lens, using university clinics as the reference point. These centres anchor tertiary care, coordinate multi-site networks, and run large registries. They pair day-to-day care with research, so they feel data fragmentation first. They also have the most to gain when population health analytics becomes part of daily work. Our examples focus on this segment, but the principles travel across settings.
University clinics in Europe manage growing complexity. Chronic diseases account for about 80% of the EU disease burden. Two out of three people at retirement age live with at least two conditions. As a result, pathways are lengthy, multi-specialty, and costly to run.

Europe’s health workforce is stretched: an estimated 1.2 million doctors, nurses, and midwives are missing, and a large share of those in post are over 55. Demand keeps climbing: emergency departments average about 31 visits per 100 people per year, rising above 65 in Spain and Portugal. Access is uneven, too: in 2024, 3.6–3.8% of adults who needed care couldn’t get it because of cost, wait times, or distance.
Behind those numbers sits a quieter issue: data. About 25% of people with chronic conditions did not receive basic preventive tests last year, despite clear guidance. Avoidable admissions for asthma, heart failure, and diabetes remain high, signalling gaps in coordinated, population-level management.
In this article, we explain population analytics and show how a platform like Kodjin Analytics can turn fragmented data into actionable insights for everyday decisions. You’ll also find high-impact population health management analytics use cases.
Highlights:
- Chronic diseases account for about 80% of the disease burden in the European Union (EU).
- Two in three people at retirement age live with at least two conditions.
- Emergency departments see ~31 visits per 100 people annually across the EU.
- Over 110 million people in the EU live with a mental disorder.
What Is Population Health Analytics?
Population health analysis utilizes data to track the progress of patient groups over time. For a university clinic, it means following chronic disease cohorts across hospitals, observing how treatments and pathways affect outcomes, and identifying where people struggle to access care.
Analytics vs. management
Analytics and management play different roles. Analytics shows where risk, gaps, and variation are. In turn, management uses those population health insights to change pathways, target outreach, or invest in new services. Most university hospitals already try to manage populations. Yet, the real challenge is obtaining clean, joined-up data quickly enough to inform those decisions. That’s the gap that reasonable population healthcare analytics solutions are meant to close.

Population Health Analytics in Ongoing Care Management
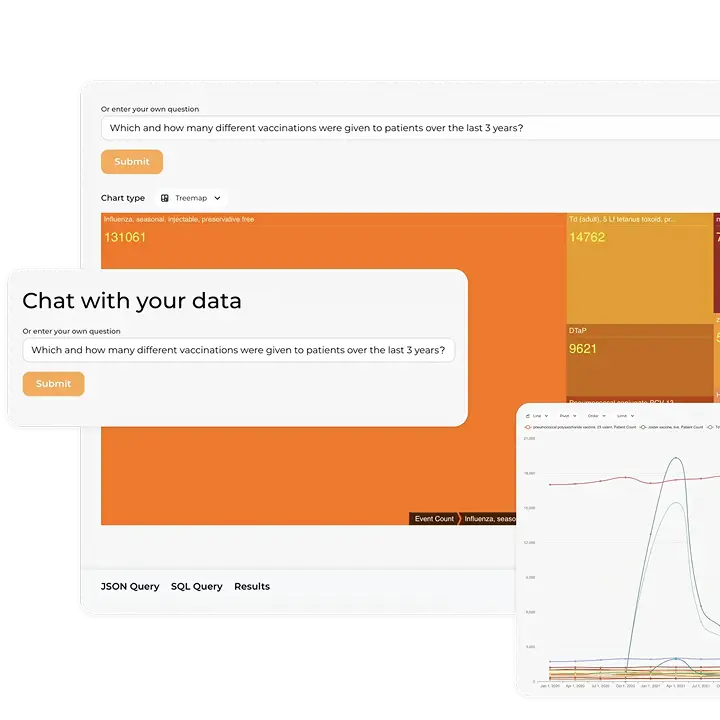
For years, population health lived in retrospective studies: teams cleaned data, published reports, and waited months for change. Ongoing care management needs the same insight on a near-real-time loop so teams can steer pathways weekly, sometimes daily, while it still matters. That shift depends on democratized access: clinicians and care managers should ask questions in plain language, see governed answers, and move from signal to action without opening a ticket.
Managing diabetes, hypertension, chronic obstructive pulmonary disease (COPD), or heart failure requires continuous monitoring and proactive outreach from healthcare specialists. With natural-language queries, care teams need abilities to ask, “Which diabetes patients haven’t had a glycated hemoglobin (HbA1c) in six months?” or “Show heart-failure patients with an Emergency Department (ED) visit in the last 30 days and no follow-up booked.” The platform needed for such interaction tracks care gaps, medication adherence, and outcomes, and prioritizes worklists so coordinators can focus on patients.
The effect is clear at the point of care. Fewer patients are readmitted because high-risk people are spotted and supported earlier. Care gaps are caught in time to fix them. Chronic disease outcomes and quality of life improve thanks to regular monitoring and follow-up. Care coordinators also get a more manageable workload because clear, prioritized lists show them exactly where to focus.
Challenges of Applying Population Health Analytics in Ongoing Care Management and How Kodjin Helps Overcome Them
Many clinics still juggle a mix of systems: several EHRs, separate lab and imaging feeds, billing and registry data, plus national datasets. As a result, the data is scattered across different warehouses, while BI, research, quality, and public-health teams run their own setups. Identity, terminology, and governance live somewhere else again. It works until you need something new. Then every new cohort, equity cut, or data source becomes a small project that eats up time and attention.
Kodjin Analytics pulls that sprawl into one place. It brings EHR, registry, billing, and ancillary data into a single FHIR-based longitudinal record and serves it through a governed semantic layer, so cohorts and metrics are defined once and reused across dashboards, quality programs, operational lists, research queries, and AI-assisted exploration. A natural-language assistant turns plain questions into reproducible views, and near-real-time pipelines deliver signals quickly enough to adjust care and operations while it still matters.
Just as important, the insights show up where people already work. Lists, alerts, and measures surface inside the EHR and care-management tools, with privacy, audit, and modern interoperability (HL7 v2, CDA, flat files, FHIR in; SMART on FHIR and OAuth2 out) handled behind the scenes. Adoption goes up, effort goes down, and the focus returns to patients.
Most common population healthcare data analytics challenges Kodjin solves:
- Data quality and timeliness. Incomplete or late feeds undermine trust. Kodjin unifies sources in a governed FHIR layer, surfaces missing or stale fields in-line, and routes fixes to owners so improvements show up on the same dashboards.
- Interoperability and master data management. Duplicate and mismatched IDs distort cohorts. Kodjin reconciles identities and maps HL7 v2, CDA, flat files, and FHIR into one longitudinal record with consistent semantics.
- Privacy, consent, and secondary use. You need insight without breaking the General Data Protection Regulation (GDPR) and the European Health Data Space (EHDS) rules. Kodjin applies privacy-by-design, purpose limits, role-based access, audit, and pseudonymization, so operational population health data analytics use and secondary use can safely coexist.
- Models, bias, and explainability. Opaque scores don’t earn trust. Kodjin exposes cohorts, features, thresholds, and subgroup performance, shows why a patient was flagged, and lets clinicians override when needed.
- Clinician adoption and workflow fit. Extra portals slow people down. Kodjin can bring measures into the electronic health records (EHR) and care-management tools, so insight appears at the moment of care.
- Keeping measures and models current. Populations change, and models drift. Kodjin versions metrics, tracks lineage and performance, and supports scheduled reviews and controlled retraining to keep signals accurate.
- Democratized analytics through natural language (LLM-enabled). Complex queries shouldn’t require SQL, data engineers, or FHIR expertise. Kodjin’s governed semantic layer enables LLM-assisted querying: clinicians, quality teams, and researchers can ask business-level questions in plain language and receive validated, compliant, and reproducible answers based on high-quality and current data.
How Kodjin Supports Different Population Health Data Analytics Use Cases
University clinics use population health statistics in two major ways: to manage care (care management) and to study large cohorts over time (observational research). A unified, FHIR-native view of patients, supported by Kodjin and its large language model (LLM) assistant, lets clinical and research teams explore questions quickly and act on them without months of manual data preparation.

1) Care management
Antimicrobial resistance (AMR) stewardship and infection outcomes
AMR is a major public health threat in Europe. It causes ~35,000 deaths a year in the EU/EEA, with hundreds of thousands more linked to resistant infections. When resistant organisms appear, they can spread across units, leading to severe infections, sepsis, and preventable mortality, along with longer stays and other downstream complications. The core challenge is not the lack of data, but the inability to see early warning signals across the hospital quickly enough to intervene.
Labs, prescribing systems, and outcomes teams each capture their own part of the picture, but not in a way that exposes how resistance patterns evolve or move through wards. Kodjin consolidates these data streams into near-real-time surveillance views that reveal emerging resistance, unusual usage patterns, and potential cross-unit spread. It detects risk clusters based on rules and statistical thresholds and supports targeted stewardship actions.
Mental health and crisis care
About one in six Europeans, over 110 million people, live with a mental disorder. Many first touch the system through EDs (Emergency Departments) and miss timely follow-ups. University EDs absorb a large share of crises and see drop-offs between ED discharge, primary care, and specialty follow-up. Missed appointments and inconsistent handoffs often result in repeat visits.
Kodjin helps unify ED encounters, primary-care visits, therapy schedules, and community services, flag missed follow-ups, and prioritize outreach lists. Teams shorten time to planned care and reduce preventable crises, with equity cuts that reveal neighborhood-level gaps.
Cancer pathways and outcomes
There were an estimated 2.74M new cases and ~1.3M deaths from cancer in the EU in 2022. Just six tumor types drive about half of new cases and deaths. Leaders need a line of sight from the first symptom or screen to survival.
Kodjin provides a unified analytical view of cancer pathways, exposing delays, unwarranted variation, and deviations. Kodjin shows how cancer care differs across hospitals and departments: how quickly patients start treatment, how severe their complications are, and how well they do in the end. It makes it easy to see where care is inconsistent and where some teams achieve better results. This helps organisations understand what works best, check whether clinical guidelines are being followed, and focus improvements where they will make the biggest difference for patients.
Chronic disease management (diabetes, heart failure, COPD)
University clinics care for many people with multiple conditions and absorb the cost of missed monitoring. As patients move between clinics and wards, routine checks slip, and so do blood-sugar tests, timely dose increases for heart-failure medicines, and consistent inhaler use, so problems are often found late.
Kodjin unifies ambulatory, inpatient, pharmacy, and remote data into longitudinal records, ranks care gaps by clinical impact, and generates prioritized, explainable worklists within existing tools. Teams focus outreach on patients most likely to benefit, which reduces avoidable exacerbations and readmissions, improves control and quality of life, and keeps the coordinator’s workload sustainable.
Readmission and emergency department (ED) visit reduction
In university clinics, ED crowding and repeat admissions are common, and signals get buried in daily noise.
With Kodjin, service leads see same-week trends by ward and procedure, connect results to specific actions (48-hour calls, remote monitoring, and discharge bundles), and scale what works. The payoff is fewer avoidable returns and more predictable bed capacity.
Preventive care and screening adherence
Regular check-ups and screenings work, and they help catch illnesses early. But not everyone comes when they should, and participation differs a lot between regions and patient groups. When people with several chronic conditions skip monitoring or follow-up visits, their symptoms can worsen unnoticed, leading to flare-ups, emergency visits, and hospital readmissions.
Kodjin helps teams quickly see which groups aren’t attending screenings or follow-ups and where participation is low. It shows patterns in uptake across regions and patient segments, so teams can decide what types of outreach to try, whether SMS reminders, weekend clinic hours, or mobile units, and then evaluate which approaches actually improved attendance. As a result, screening rates improve earlier, before small issues grow into serious health problems.
Medication adherence problem and therapy optimization
At university clinics, complex regimens and multimorbidity make non-adherence and polypharmacy a quiet but persistent driver of harm and cost, especially for older adults moving between specialty clinics and inpatient wards. When medications are stopped or switched without support, exacerbations, ED use, and readmissions follow.
Kodjin brings together prescribing, dispensing, labs, vitals, and encounters to spot where adherence slips (late refills, dose gaps, or early stops) and reveals patterns like risky combinations, missed dose increases, or side effects after changes. It flags at-risk patients (so teams can propose safer or step-down regimens) and tracks outcomes after each adjustment, allowing teams to focus on actions that actually reduce events and improve control.
Care coordination across settings
In university clinics, patients move between tertiary wards, specialty clinics, rehab, long-term care, and community services, often within an affiliated network. Handoffs break when discharge summaries arrive late, medication lists drift across systems, or follow-ups slip, which drives avoidable ED returns and readmissions.
Kodjin maps every transition across the academic network, hospital, rehab, home health, community partners, and flags failure points by ward, service, and facility. Clinics see smoother handoffs, fewer preventable transfers, and better capacity on high-acuity units.
Equity analytics
Eurostat shows persistent socio-economic gradients in unmet need and self-reported health. Deprived areas see higher admissions for chronic conditions. Equity must be measurable and actionable.
Kodjin stratifies waits, screening, treatment, and outcomes by equity factors across all university and partner sites, overlays Social Determinants of Health (SDOH) context to reveal where access breaks down, and tracks whether gaps narrow. This supports quality programs, community-benefit reporting, and more equitable outcomes for underserved groups.
2) Observational research
Real-world evidence and cohort studies
University clinics run multi-site studies and registries and must reproduce results for funders and auditors. Teams need cohorts they can defend and reuse across departments.
Kodjin normalizes sources, provides a governed cohort builder shared across services, and maintains lineage for audits. That shortens the study setup and improves the time to submission and publication.
Comparative effectiveness and safety
Complex, multimorbid patients are common in university clinics, where trial evidence is limited. Decisions must withstand scrutiny from clinical governance, tumor boards, and formulary review.
Kodjin ships versioned, reusable measures with proper adjustment options, so tumor boards and formularies can act with confidence.
Pharmacoepidemiology and safety signals
Risky drug combinations can raise harm before guidelines change. Early signal detection and confounder control are essential.
Kodjin brings prescribing data, lab results, and clinical events into a single analytical layer and applies covariates consistently, allowing pharmacovigilance teams to spot emerging safety signals sooner and assess their credibility within existing university governance processes.
Registries and long-term follow-up
University clinics host disease and device registries that span years and multiple sites, where drifting definitions can undermine findings.
Kodjin provides a consistent analytical structure for these registries: shared templates, clear versioning, and unified outcome definitions. This helps teams collect comparable data across sites, track long-term results with confidence, meet accreditation and quality-improvement reporting requirements, and reduce the manual effort normally needed to reconcile differences between centres.
Model validation and data readiness for AI
Academic centers pilot AI in care and research, but models fail without governed data, lineage, and monitoring that satisfy IRB and regulatory expectations.
Kodjin creates that foundation. Its semantic layer standardizes meaning across university and affiliate systems and enforces data-quality rules. This makes datasets analysis-ready for model development and validation, and ensures that teams can demonstrate precisely how inputs were defined, transformed, and evaluated.
Kodjin’s semantic layer is also designed to be naturally interpretable by Large Language Models (LLMs) without fine-tuning. Instead of technical field names and fragmented legacy structures, it exposes clear business and clinical concepts. This enables LLMs to reason with healthcare data accurately, reduces hallucinations, and lets developers assemble AI-powered applications quickly using reusable, context-aware components.
Conclusion
Population health reporting delivers real value when it moves from a research silo into the flow of care. For European university clinics that balance tertiary care, regional networks, and research, the biggest gains come from one governed, FHIR-native view that everyone trusts. When clinicians, managers, and analysts work from the same record, they replace after-the-fact reporting with timely course correction and direct scarce staff time to changes that improve outcomes and costs.
The path is practical. Start with a few high-impact cohorts and measures. Resolve identity and semantics once at the platform level. Build privacy, purpose limitation, and audit into the environment from day one. Put insights where work already happens, inside the EHR and care-management tools, so teams or population health data analysts do not chase another portal. Treat models and metrics as living assets with clear ownership, scheduled review, and disciplined retraining.
A platform like Kodjin Analytics shortens the distance from question to action. It consolidates fragmented sources into longitudinal FHIR records, aligns terminology across domains, and adds an LLM assistant for plain-language, reproducible analysis. That combination supports near-real-time care management and rigorous observational research on the same foundation, with measurable equity views and feedback loops tight enough to adjust while it still matters.
If you’re exploring a population health analytics platform or need help building one, our team is here to support you. Feel free to contact us.
FAQs
How is population health analytics different from traditional reporting?
Traditional reporting is retrospective and static with monthly or quarterly KPIs. Population health analytics is longitudinal and cohort-aware. It refreshes quickly, highlights risk and care gaps, and embeds insights in daily workflows. It also runs on a standards-based model (e.g., FHIR) with identity resolution and governance, so teams trust and reuse the same definitions across quality, research, and operations.
Which teams should own population health analytics?
Ownership is shared. Clinical leaders set outcomes and safety guardrails. Operations ensure insights land in real workflows. Data/IT runs the platform, quality, and semantics. Privacy/legal defines lawful population health management analytics use. A small steering group keeps a single backlog and approves changes to cohort and measure logic, one playbook for everyone.
Build vs. buy: when should we choose a platform?
Buy when you need fast time-to-value, proven interoperability, built-in governance, and have limited engineering capacity. Build if your needs are unique and you have a mature data team to maintain the stack. Many hospitals are going hybrid: adopting a FHIR-native backbone and extending it with custom models and business intelligence (BI). Evaluate master patient index (MPI) integration, lineage/quality, privacy-by-design controls, workflow embedding (EHR/care-management tools), LLM support, versioning of cohorts/measures, open APIs, and deployment fit (on-prem/private cloud).
How do we reduce model bias and ensure fairness?
Use representative data and transparent features. Check calibration and performance in key subgroups, not just overall. Provide reason codes for each flag and allow the clinician to override. Monitor drift and equity over time and retrain under change control. Keep an equity dashboard so gaps stay visible and accountable.