Industry: Healthcare
Country: US
Project type: Analytics Platform
Duration: Ongoing
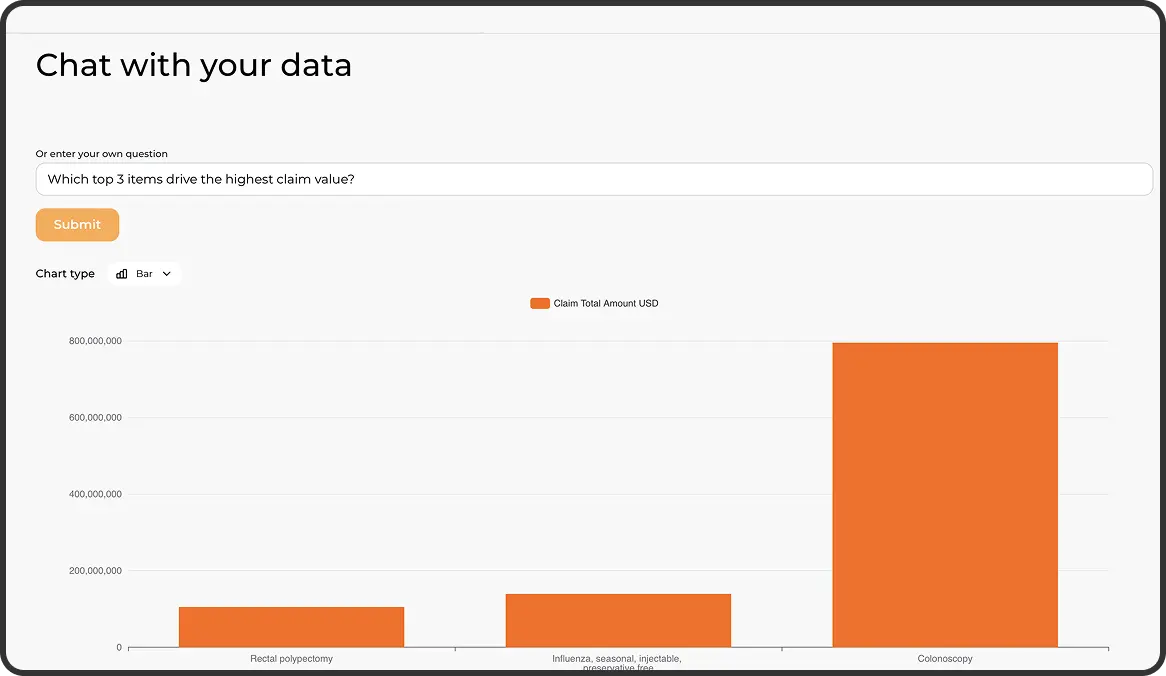
Kodjin is an AI-assisted healthcare analytics platform that enables fast and intuitive interaction with data, delivering complex, high-impact insights from multi-source datasets.

Rethink how business analysis works in your organization and eliminate every source of friction to make decisions timely, well-informed, and cost-effective.
When you have a question, it goes to an analyst, waits in a backlog for days or weeks, and by the time you get an answer, the context has already changed.
You receive static tables, slides, or pre-configured dashboards, but you can’t freely explore your thinking. You end up navigating metrics and filters or waiting hours or even days for an analyst to answer a follow-up question.
The same term is defined differently across departments. Similar concepts are used inconsistently. Reports don’t match. As a result, decisions are based on fragmented and sometimes conflicting information.
Your organization needs a team of skilled business analysts. Every query requires dozens of steps and several data management tools.
When data is hard to access, decisions are made on intuition instead of evidence, opportunities are missed, and problems go undetected until they become crises. Leave it in the past.
Executive managers now can identify margin drivers, validate new monetization and de-risking strategies within the same day.
Department heads can evaluate treatment protocol or operational approach effectiveness, compare performance across cohorts, and identify bottlenecks using dozens of parameters.
Clinicians and administrators receive instant, decision-ready insights at the point of care to act faster and reduce risk without leaving their workflow.
Business analysts and IT teams can reduce ad-hoc reporting workload by up to 90% and focus on advanced modeling and governance instead of rebuilding dashboards on request.
Executive managers now can identify margin drivers, validate new monetization and de-risking strategies within the same day.
Which locations carry the highest encounter volume, and what clinical conditions drive demand at each site?
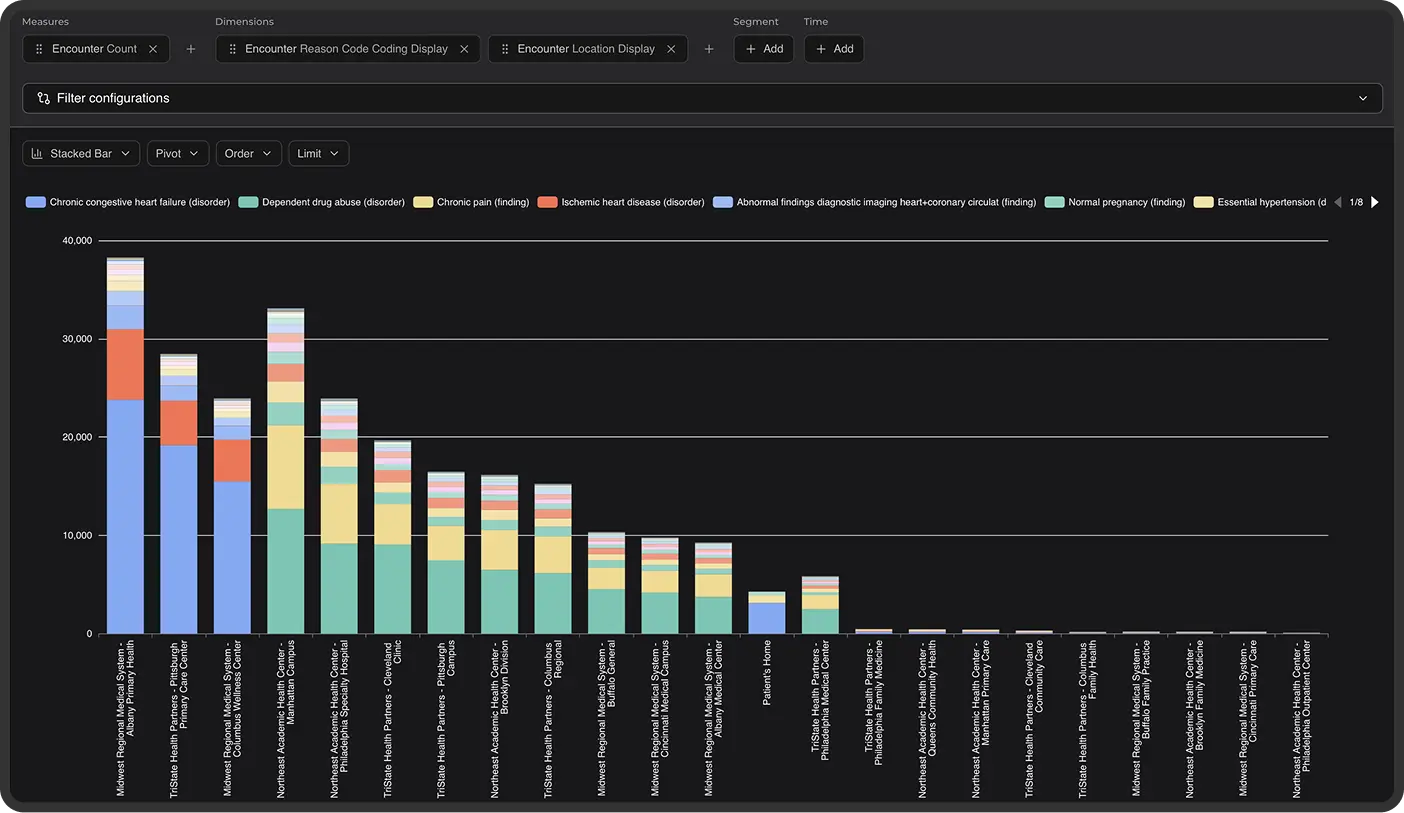
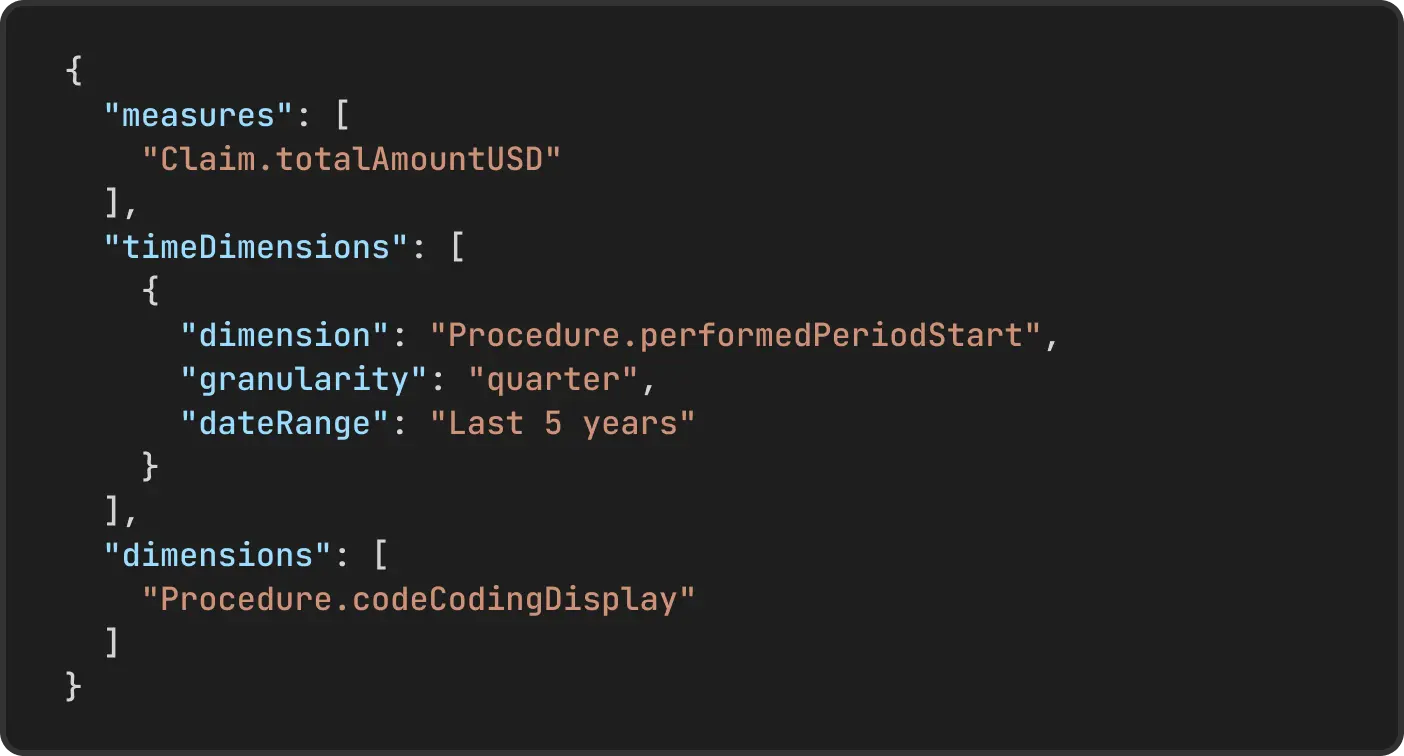
Use an AI assistant and visual query builder.
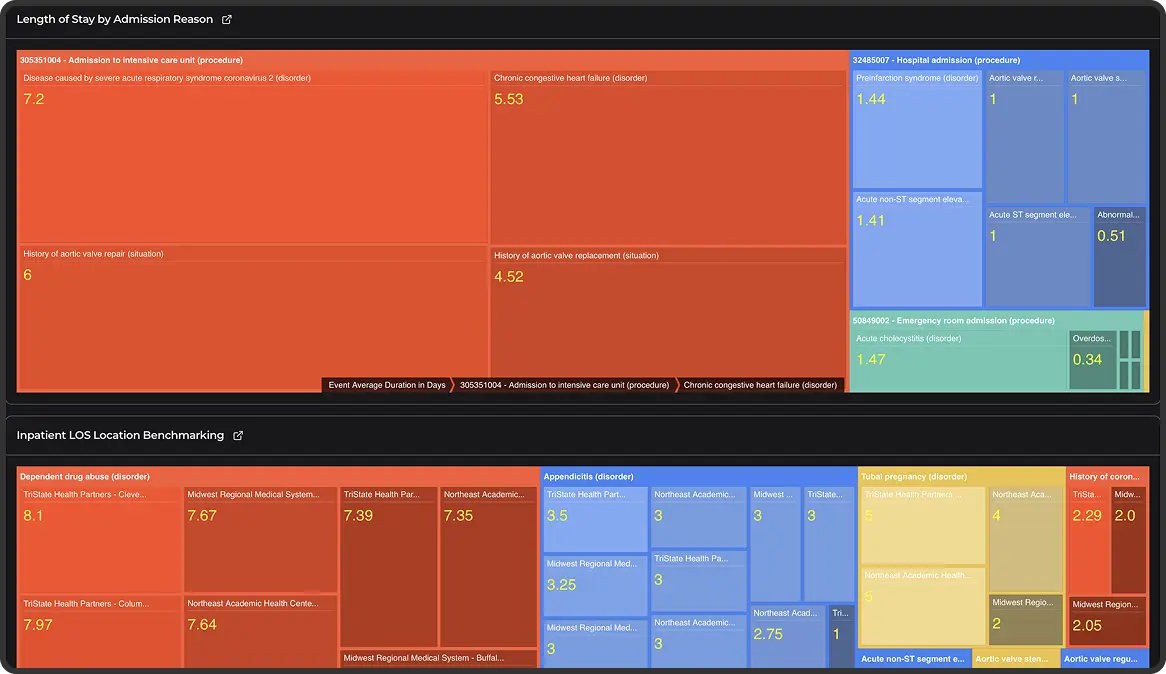
Department heads can evaluate treatment protocol or operational approach effectiveness, compare performance across cohorts, and identify bottlenecks using dozens of parameters.
Which procedures drive the majority of our clinical workload, and how has their share changed year over year?
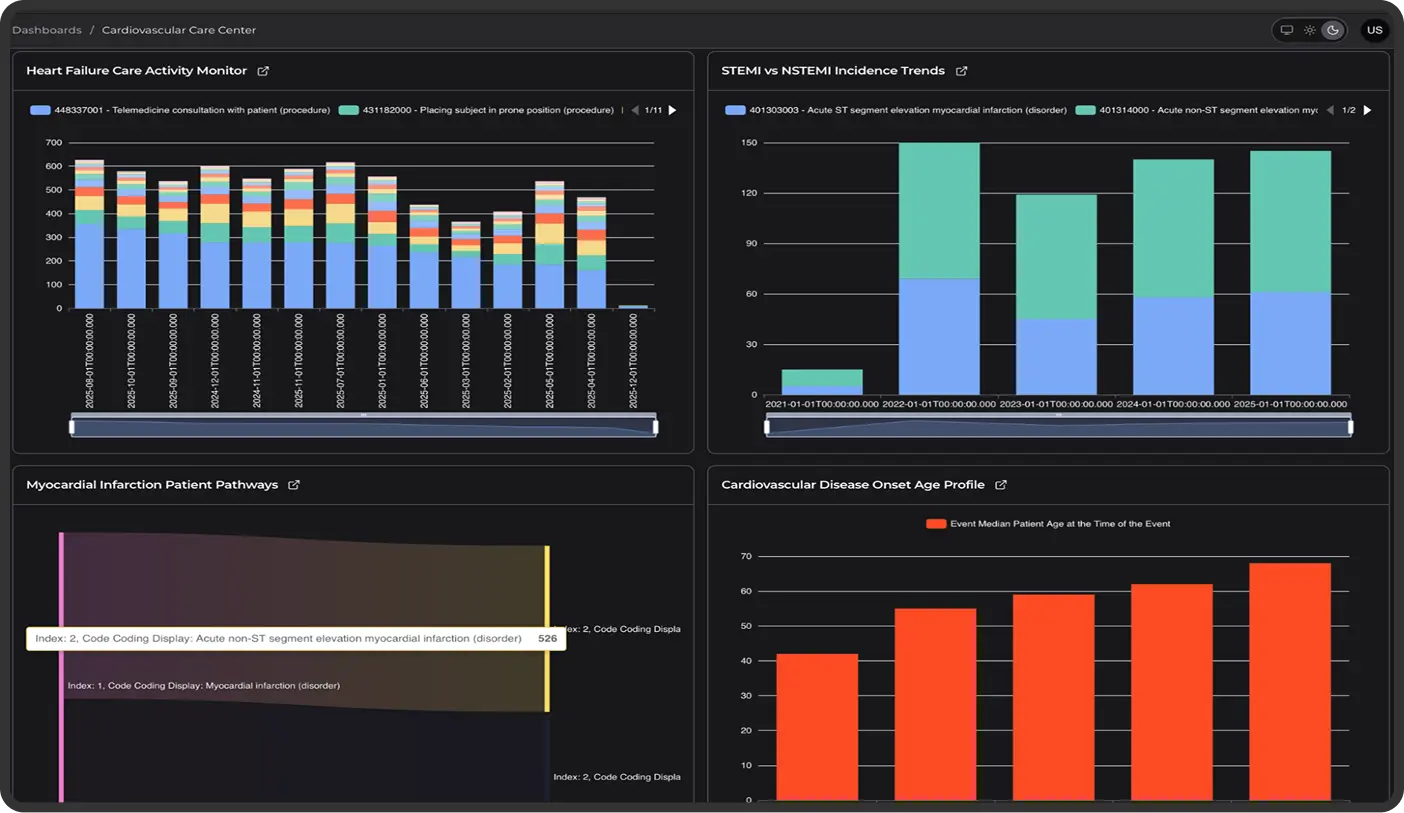
Use an AI assistant and query builder for manual metrics and filters specification, collect dashboards to monitor dynamics.
Clinicians and administrators receive instant, decision-ready insights at the point of care to act faster and reduce risk without leaving their workflow.
What is the HbA1c trend for this patient for the last 2 years?
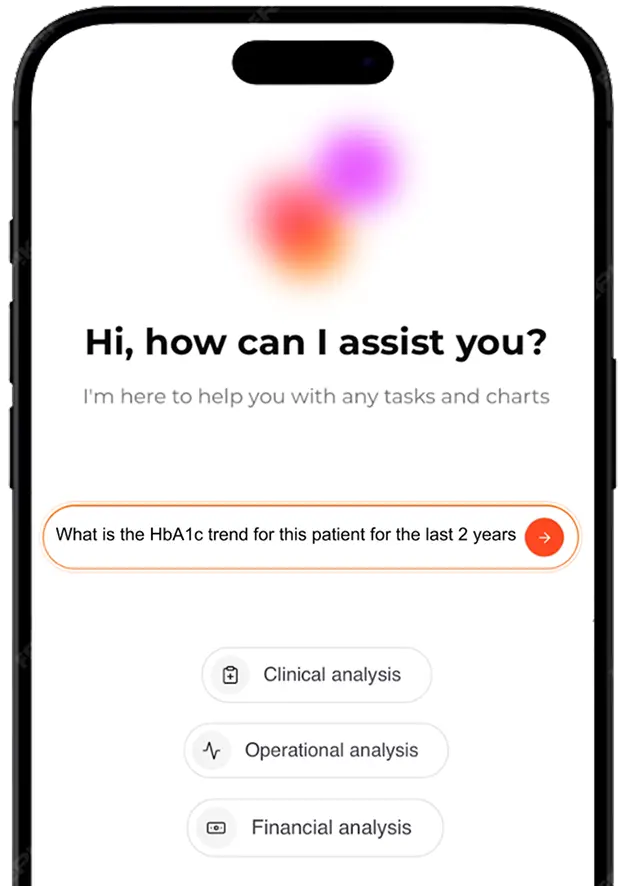
Use an AI chat embedded into an operational application.
Business analysts and IT teams can reduce ad-hoc reporting workload by up to 90% and focus on advanced modeling and governance instead of rebuilding dashboards on request.
Use semantic layer API access and direct database connectivity.
Conversational UI delivers real value only when built on structured, governed data.
The infrastructure-first approach we apply in the Kodjin healthcare data analytics platform turns AI into a controlled, outcome-driven capability aligned with your business priorities.
Towards the future of data-driven decision making
AI Capabilities
To the advances analytical capabilities
Analytical Capabilities

To the unified standardised and validated datasets
Data Materialization
From fractured unstructured healthcare data
Healthcare Data
Kodjin Analytics isn’t just a BI tool for performance tracking, it’s a thinking layer over your data. Using cohort logic and temporal modeling, our healthcare analytics software uncovers hidden patterns and pinpoint areas for improvement.
With our healthcare analytics solutions you can identify at-risk patients earlier, prioritize interventions, and optimize treatment pathways using unified clinical, operational, and SDOH data to improve outcomes while reducing unnecessary costs and coordinator workload.
Improve performance visibility across HEDIS, CMS Star Rating, and MIPS by moving from retrospective reporting to real-time quality measure tracking, enabling stronger compliance and higher value-based reimbursement. These capabilities make Kodjin a strong foundation for healthcare payer analytics solutions.
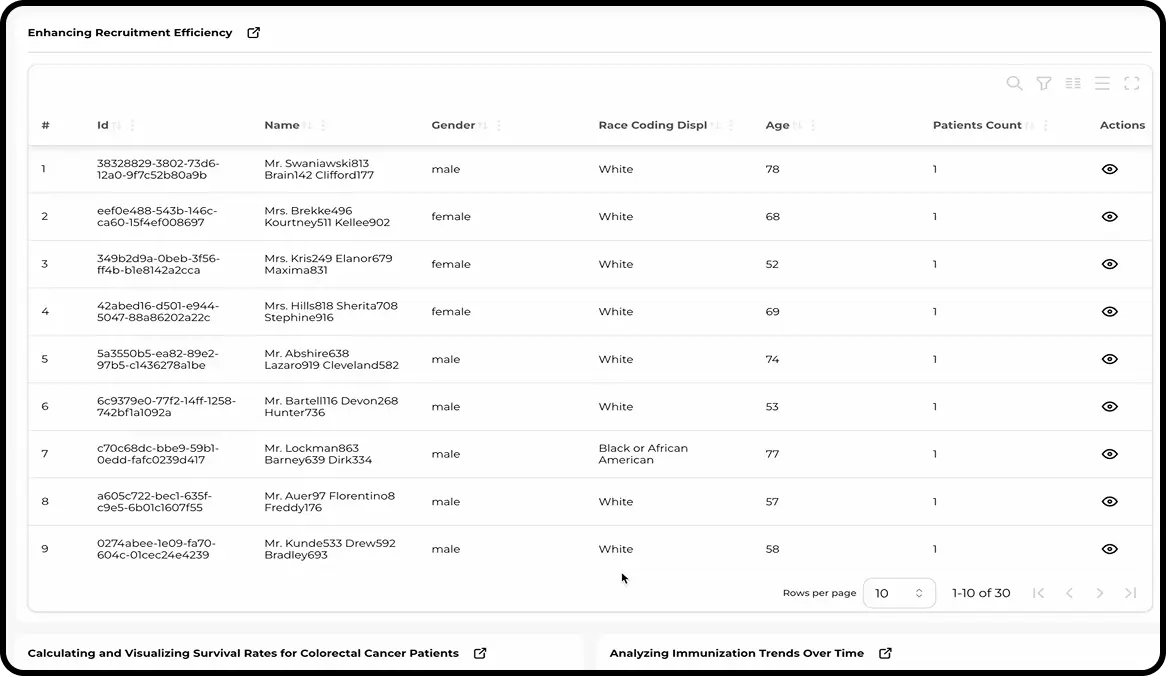
With our hospital analytics software you can accelerate retrospective cohort studies and clinical trial feasibility assessments by querying structured clinical data against complex inclusion and exclusion criteria in seconds, eliminating weeks of manual chart review, enabling faster hypothesis validation, and increasing trial activation speed.
Improve cost transparency and margin performance by moving from siloed cost reporting to integrated cost-to-outcome analysis, enabling faster identification of high-value drivers, variation, waste, and inefficient care pathways.
With Kodjin’s medical data analysis software you can improve patient engagement and retention by identifying individuals overdue for screenings and vaccinations, triggering targeted outreach based on risk and eligibility criteria, and enabling self-service analysis through personalized patient portal experiences.
Cut avoidable readmissions by 15-30%

Reduce quality reporting lag by up to 90%
Get 9X more eligible patient matches
Reduce total cost of care by 8-15%
Increase patient lifetime value by 10-20%
Capability
 Kodjin Analytics (Healthcare-native)
Cross-industry analytics
Insight accuracy
Turns raw data into clinical concepts and understands their relationships (“cardiac events” = “arrhythmias”, “heart failure”).
Risk of semantic distortion when clinical meaning is translated into generic data structures.
Security and compliance
PHI remains within governed healthcare infrastructure aligned with HIPAA and GDPR. Role-based access, audit logging, consent-aware controls are embedded in the architecture.
PHI is often exported into external data warehouses or BI tools, expanding HIPAA and GDPR exposure. This requires additional custom security engineering.
Organizational scalability
One semantic foundation supports clinical, financial, and operational teams.
Each new use case requires additional modeling, engineering effort, and ongoing maintenance.
Fit to healthcare workflows
Designed around real use cases, supports how healthcare organizations actually operate.
Optimized for generic business reporting. Workflows must adapt to healthcare data analytics tools, not vice versa.
Time to value
Immediate cohort and longitudinal analytics without rebuilding data logic.
Months of semantic modeling and ETL work before insights become reliable.
Upfront investment
Ready for healthcare data out of the box. No data model re-engineering required.
Requires major investment in transforming, flattening, and remapping medical data and other healthcare data analytics services before value can be delivered.

Kodjin is complete with a full-featured ELT, terminology service, database, API, and user-facing UIs, no extra warehouses or gateways needed.

Our healthcare analytics solution connects to the tools your data team and staff already use and embeds seamlessly into operational applications and clinical workflows.

We design, configure, and deploy the full data infrastructure end-to-end, from integrations and pipelines to activation workflows.

Your teams can use the system immediately without building analytics expertise.

Our healthcare analytics company handle updates, optimization, and ongoing improvements and transfer knowledge to your internal team.

We can extend analytics capabilities across departments and operationalize AI at scale.
Adopt advanced healthcare analytics without the IT burden.
We implement everything. You just open the chat and ask your question.
Kodjin Health Analytics Platform integrates seamlessly with the Kodjin stack. This ensures that data is systematically tracked and managed for accurate, real-time analytics.
A tool created to retrieve data from diverse sources, then transform, validate, and store it in FHIR, HL7v2, or other medical formats. We offer ready-made pipelines tailored to customize to your unique business requirements, streamlining the setup process and saving you time.
When evaluating healthcare data analytics software, hospitals can look for solutions that bring clinical, operational, and financial data into a consistent structure and support meaningful insights rather than static reports. It helps when the platform offers natural-language interaction for clinicians, reliable semantic alignment across teams, and the ability to analyse longitudinal patterns such as care pathways or changes in patient status.
Kodjin’s data analytics software for healthcare supports predictive modeling by providing an AI-ready data foundation that combines historized records, clear clinical concepts, and temporal patterns. Our AI layer interprets cost drivers and clinical relationships, giving payer data teams the structured context they need to build and refine predictive models that identify rising-risk members and cost escalation earlier.
Hospitals looking to improve patient outcomes and manage rising costs benefit most from analytics platforms that can identify high-cost patients early, reveal the underlying drivers of avoidable utilization, and track chronic conditions in real time. Since 5-10% of patients typically account for the majority of spending, solutions like Kodjin help care teams surface these members instantly and understand why costs are escalating, whether due to ER overuse, unmanaged comorbidities, or gaps in care.
It’s important that clinical, operational, and financial data can be combined consistently, and that reports can be adapted as guidelines or internal priorities change. Solutions like Kodjin provide a semantic layer and natural-language interface that make it easy to build custom views (from chronic-care gaps to episode-level cost comparisons), while ensuring that every report is grounded in the same validated, FHIR-based data foundation.
Advanced analytics offers more than healthcare analytics solutions for reporting. Unlike traditional BI tools that track historical KPIs and static dashboards, advanced analytics helps you understand why things happen and model different scenarios. In healthcare, this means not just viewing data, but interpreting it through a clinical, financial, or operational point of view, for example, identifying at-risk patients across time.
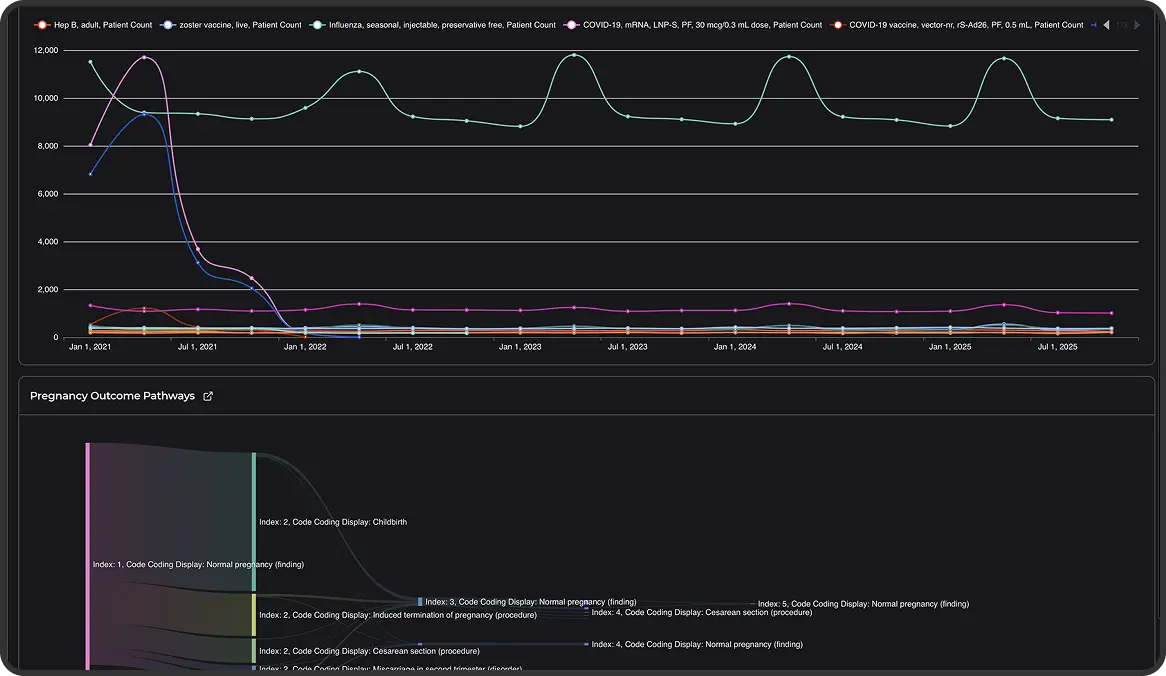
Longitudinal analytics helps you see the full story of a patient or population over time. Instead of isolated events, it connects data points – diagnoses, lab results, treatments – into timelines that show trends, gaps, and progress. This approach is key to understanding care quality, treatment outcomes, and long-term costs, and is used in the best healthcare analytics software.
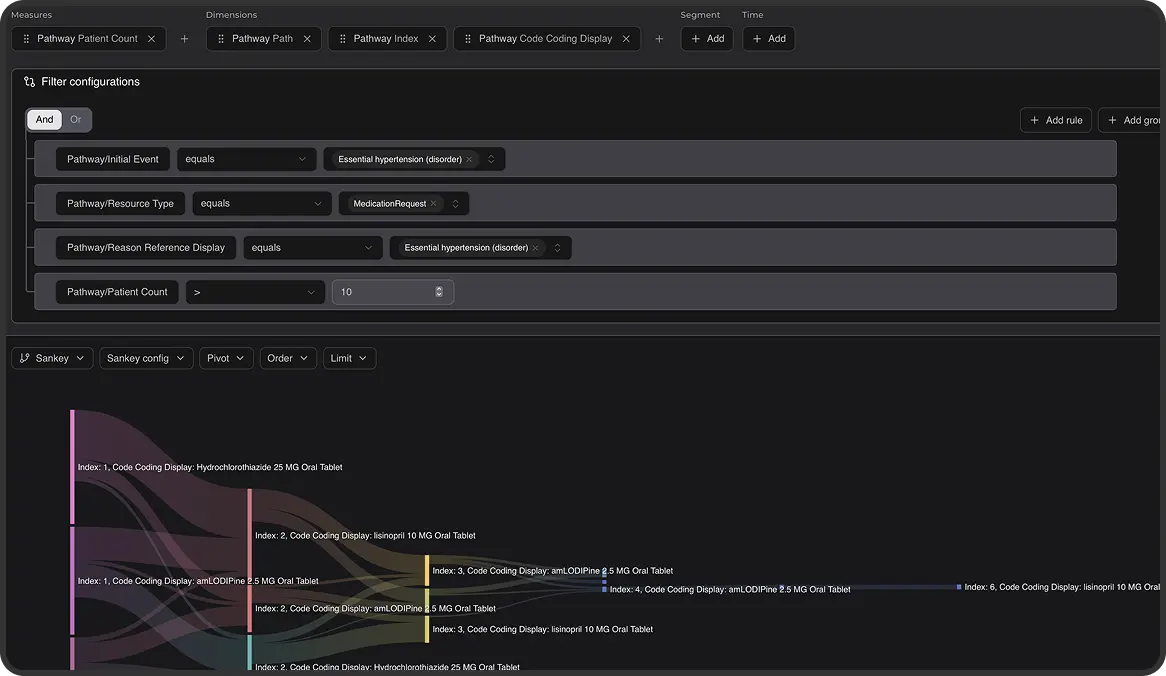
Pathway clinical analytics software maps out how patients move through the healthcare system: from diagnosis to treatment and follow-up. It shows which paths are typical, where delays or drop-offs occur, and what leads to better outcomes.
Temporal analytics focuses on the “when.” It looks at the timing and sequence of events like how long it took between diagnosis and surgery, or what happened within 30 days of discharge. In clinical and financial settings, such healthcare data analytics solutions help detect early warnings, monitor standards of care, and spot patterns that impact results.
Cohort-based data analytics solutions for healthcare groups patients with shared traits — like condition, age, or treatment type — so you can study how those groups behave over time. It’s used for clinical trials, population health, and care optimization, helping you understand what works for whom, and when.
Kodjin healthcare data analytics software brings a new level of flexibility powered by an agentic LLM. Instead of rigid dashboards or waiting on analysts, users can ask questions in natural language and instantly get the right reports. This AI-driven interaction bridges the gap between teams and data, making analytics accessible for clinicians, managers, and researchers alike, without needing technical expertise or SQL skills.
Yes, but not out of the box. While FHIR is ideal for storing and exchanging healthcare data in a standardized way, its deeply nested and fragmented structure makes it hard to use for analytics directly. Kodjin Analytics solves this by transforming FHIR records into streamlined, analysis-ready datasets and then into intuitive business concepts that are easy to explore, reason with, and act on.
It marks a true paradigm shift. Kodjin’s semantic layer transforms raw, fragmented healthcare data into clear business concepts like “patient,” “episode of care,” or “treatment phase.” This lets clinicians, managers, and analysts speak the same language and work together without technical translation. With Kodjin, medical analytics software becomes not just accessible, but truly collaborative, turning complexity into clarity and data into decisions.
Please leave your email to get Kodjin Analytics White Paper
We have sent a copy to your email
Please leave your email to get Kodjin White Paper
We have sent a copy to your email
Back to website content